EnvisioKnit User's Manual
Download a print-friendly version (PDF).
Table of Contents
- Getting Started
- The Chart Editor
- The Pattern Editor
- The Yarn Studio
- Stitches
- Printing and Exporting
- Settings
- Tools
- Hotkeys and Shortcut Keys
- Other Features
Creating Picture Charts
EnvisioKnit's Picture Chart tool creates knitting charts from photos or other images. This tool offers fantastic creative possibilities, allowing you to quickly create striking graphical charts. To open the Picture Chart tool, go to Tools->Create Picture Chart.
Choosing an Image
When you first start the Picture Chart tool, you will need to select an image file to use. You can use .png, .jpg or .bmp image files. For graphical charts, images with good color contrast work best. You will be able to position and size the chart to use all or just a part of the image.
Selecting Colors
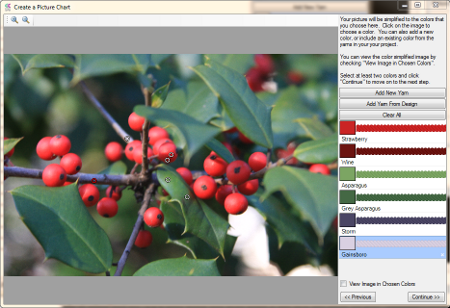
Selecting Colors to Use from the Image
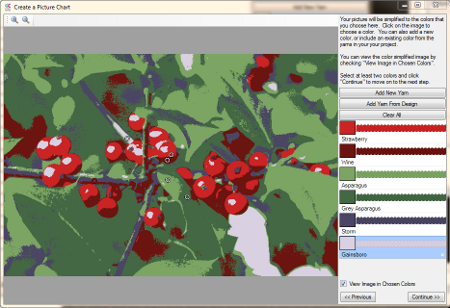
Viewing the Image in the Chosen Colors
With your image loaded, you must now choose the set of colors that you want in the chart. Most images are composed of thousands of colors, but to make a practical knitting chart you will want to use only a handful of yarns. You may choose as many yarns as you want to use, but you must choose at least two. The image will be simplified to use only the yarn colors you have chosen.
One way to choose a color is to click on the image over the color you want. A selection ring will appear on the image where you clicked and the color at that location will be added to your yarn palette. You can adjust the color you have just added by dragging the selection ring around the image. The associated yarn color will be updated to the color of the image under the selection.
To remove a selection, click on it and then press the Delete key. You can also remove the yarn in the list by selecting it and clicking the red X that appears in the lower right corner.
Another way to add yarns to the list is to click Add New Yarn. Doing so will allow you to choose colors that are not in the image. Yarns that are already in your current design can be added by clicking Add Yarn from Design. If you choose yarns from your design you can import the image using the color scheme you have already established.
To see how your image looks in just the colors you have chosen, check the "View Image in Chosen Colors" option, under the yarn list. In the reduced image, each color will be replaced with the closest color that you have chosen.
Click Continue to proceed to the next step.
Sizing and Positioning the Chart
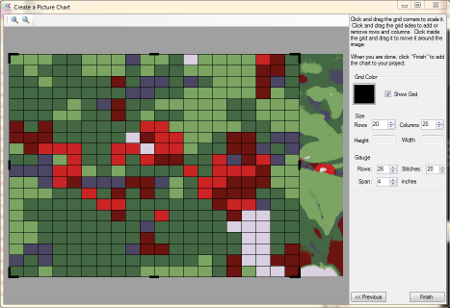
Chart Overlay Before Sizing and Positioning
You will now have a chart overlaid on your image. Initially, the chart size, gauge and grid color will be set according to the default. The gauge, or aspect ratio of the grid cells, as well as the grid size and color, can be adjusted using the controls in the panel on the right.
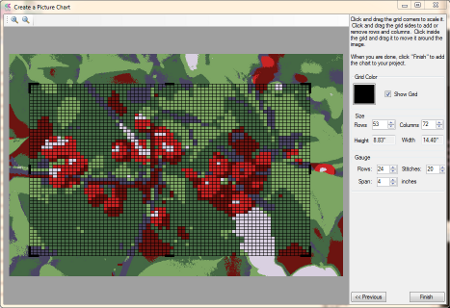
Chart Overlay After Sizing and Positioning
Click and drag a corner of the grid to expand or contract the size of the chart relative to the image.
Click and drag the sides of the grid to increase or reduce the number of rows and columns.
Click and drag on the middle of the grid to reposition it over the image.
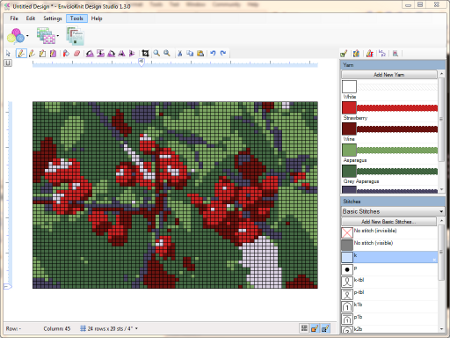
Finished Picture Chart
When you are satisfied with the grid representation of your image, click the Finish button to add it as a new chart in your design.
